JavaScript is not currently enabled, but is required for full CodeSonar manual search and browse functionality.
If you are viewing this file in your hub's Web GUI, enable JavaScript in your browser: you will also need it for GUI functionality.
If you opened this file directly from disk, your browser may be directly suppressing JavaScript functionality: certain browsers perform this suppression on local files (but not files delivered by web servers) for security reasons.
| CodeSonar® 9.0p0 Hot Tips | CONFIDENTIAL | CodeSecure Inc |
Metric reports are slightly more complicated than search result pages for other search domains, because they represent information in two dimensions: the metrics being reported, and the code elements for which metric values are shown.
This section contains general information about metric reports.
Metric report availability is independent of the language or languages involved, but the report contents will depend on the metric values available. In particular:
Important Note: the CodeSonar Web GUI makes extensive use of JavaScript. Make sure JavaScript is enabled in your web browser.
A metric report presents a subset of the metric values recorded by the hub. This subset is specified in two dimensions:
We use the following terminology.
| component search | The set of constraints used to specify which components will be in the report. Note that a component that satisfies the constraints will not be present in the report if none of the metrics included has the appropriate granularity. Component searches are specified using the metric search language. |
|---|---|
| metrics included | The set of metrics whose values will be in the report (that is, which tables the report will include). |
| table limit | An upper bound L on the size of each table in the report. By default, each table is sorted in descending order by value, so is displaying the L highest values of the metric in the search results. Sorting the table in different ways will generally cause different sets of rows to be displayed. |
| {eligible, present, displayed} component |
For a given warning report, we say a code component is:
|
The following metric report operations are provided.
| create new | Specify contents for a new metric report, then open that report. Provided by Metric Report Creation and the Advanced Search: Metrics tab. Also provided in the simple search tool when the domain/scope setting specifies the metrics domain. |
|---|---|
| edit | Change the set of metrics included in the report, or modify the component search. Provided by Metric Report. |
| save | Save a metric report (both metrics included and component search) for later access. Provided by Metric Report. |
| open saved | Open a saved metric report. Provided by Metric Report Creation. |
| filter visibility |
The Visible Metrics
selector, when available, contains the names of saved metric
reports for which you have NAMEDSEARCH_EXISTS permission.
Selecting the name of a report will impose the component search constraints on the
current page contents.
|
| delete saved | Delete a saved metric report. Provided by Manage Saved Searches. |
Several GUI page types are relevant to metric reports.
| Advanced Search | Metrics tab search functionality is equivalent to create new. |
|---|---|
| Analysis | Provides links to shortcut reports and to Metric Report Creation. |
| Chart | In charts of metric values, each chart component is linked to a Metric Report describing that component. |
| Chart Table | In chart tables of metric values, each row is linked to a Metric Report describing the corresponding component. |
| Metric Report | Displays metric reports; provides save and edit functionality. |
| Metric Report Creation | Displays analysis-granularity metrics; provides open saved and create new functionality. |
| Saved Searches | Displays descriptions of all saved searches; provides delete saved functionality. |
Metric report shortcuts are provided on the Analysis page, and from charts (and chart tables) of metric values.
Every Analysis page has metric report shortcut links (and links to corresponding shortcut charts) under Metrics:
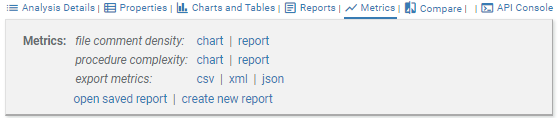
| file comment density | A metric report displaying Lines with Code and Lines With Comments for each source file in the analysis. |
|---|---|
| procedure complexity | A metric report displaying Lines with Code and Cyclomatic Complexity for each procedure encountered by the analysis. |
For charts of metric values, clicking on a chart component will link to a metric report describing the component.
For example, in a bar chart of "Total Lines per File", clicking a bar will open a metric report displaying the Total Lines value for the file represented by the bar.