JavaScript is not currently enabled, but is required for full CodeSonar manual search and browse functionality.
If you are viewing this file in your hub's Web GUI, enable JavaScript in your browser: you will also need it for GUI functionality.
If you opened this file directly from disk, your browser may be directly suppressing JavaScript functionality: certain browsers perform this suppression on local files (but not files delivered by web servers) for security reasons.
| CodeSonar® 9.0p0 Hot Tips | CONFIDENTIAL | CodeSecure Inc |
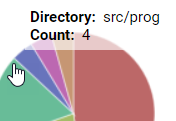
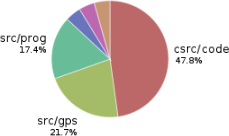
This kind of chart allows you to see at a glance whether there are project source directories that are responsible for disproportionately many warnings.
See Charts and Chart Tables: Permissions for details of the permissions that apply to charts and charting operations.
This task will produce a chart similar to the following:
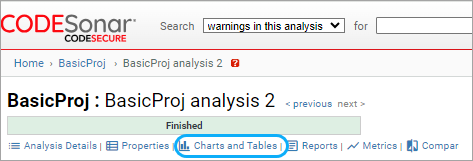
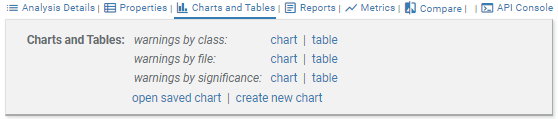
The page will expand to show the available chart and table shortcuts.